Laboratory Transport 101: How Sample Movement Shapes Turnaround Time and Quality

When hospital leaders talk about laboratory performance, the focus usually lands on analyzers, automation, or staffing. But in many hospitals, there's a quieter bottleneck hiding in plain sight: how samples actually move from where they're collected to where they're tested.
This "in-between" stage (laboratory transport and sample transportation) is often responsible for a surprising share of delays, lost specimens, and pre-analytical errors. The best instrumentation in the world can't fix a sample that arrives late, unlabeled, or compromised.
This guide offers a practical introduction to laboratory transport for operations leaders, lab managers, and clinical teams. We'll map the journey of a typical sample, identify where time and quality are lost, and show how better transport design improves both turnaround time (TAT) and patient care.
What Is Laboratory Transport?
Laboratory transport is the set of processes and systems used to move specimens from the point of collection to the laboratory, and in some cases between labs or to reference partners.
That includes:
Bedside and phlebotomy draws
Collection in clinics and ambulatory settings
Internal movement within the hospital (wards, ED, OR, ICU → central lab)
Transfers between satellites, core labs, and external partners
It covers both physical movement (who/what carries the sample: nurse, porter, courier, pneumatic tube system) and information movement (orders, labels, barcodes, and results flowing through LIS/HIS and other systems).
Done well, laboratory transport is almost invisible. Done poorly, it shows up as:
Slower TAT (especially for STAT and time-sensitive tests)
Increased recollection rates and pre-analytical error flags
Frustrated clinicians and phone calls asking, "Where are my results?"
The Journey of a Sample: From Vein to Analyzer
To understand why sample transportation matters, it helps to trace a typical sample's journey.

Step 1 – Order and Collection
A clinician orders tests in the EHR/LIS. A blood sample is drawn at the bedside, in a phlebotomy chair, or in the ED. Tubes are labeled and checked (ideally with barcodes and bedside label printing).
What can go wrong here:
Mislabeling or unlabeled specimens
Wrong tube types or incorrect order of draw
Delays between collection and dispatch (samples sitting on counters)
Step 2 – Local Holding and Dispatch
After collection, samples typically are placed in racks, bags, or carriers, wait for the next porter run, nurse round, or pneumatic tube dispatch, and are grouped with other specimens going to the same destination.
This is often where "hidden minutes" accumulate:
A porter route on a fixed schedule (every 30–60 minutes)
Nurses waiting to batch samples at shift change
Inconsistent decisions about when to use manual transport vs the tube system
Even a 5–10 minute delay per specimen can add up when repeated across an entire hospital, especially for time-critical tests.
Step 3 – Transport to the Lab
Here, methods vary:
Manual transport: nurses, porters, or dedicated couriers walking samples to the lab
Pneumatic tube system: carriers moving directly from care areas to lab stations
Vehicle couriers: between campuses or to reference labs
Things that matter:
Distance and route complexity
Frequency of runs (for manual or vehicle couriers)
System design and routing (for pneumatic tube transport)
A manual walk from ICU to central lab might take 7–10 minutes including elevator waits. A direct pneumatic route between the same points can deliver in 60–90 seconds, and it does so consistently.
Step 4 – Receipt, Accessioning, and Pre-Analytical Processing
Once in the lab, samples are received, checked in, and sorted by priority and test type. Pre-analytical processing (centrifugation, aliquoting, etc.) begins. Samples move to analyzers or further specialized workflows.
Transport delays compress this stage. If specimens arrive in large, irregular batches, labs experience:
Peaks of intense workload and idle gaps
More stress on staff to meet TAT targets
Higher risk of pre-analytical errors as volume spikes
How Laboratory Transport Shapes Turnaround Time (TAT)
Turnaround time is often treated as a lab-only metric. But transport is a major component, and one that operations leaders can influence directly.
Transport Time as a Portion of Total TAT
A typical lab TAT equation:
Total TAT = Order to Collection + Collection to Receipt (Transport) + Receipt to Result (Lab Processing)
In many hospitals, Collection to Receipt can account for 30–50% of total TAT for routine inpatient samples, and even more when transport is highly manual or irregular.
Shortening transport time (and reducing its variability) creates:
Faster STAT and urgent results
More predictable routine TAT
Greater buffer for lab processing during peak times
Variability Is as Important as Speed
Transport isn't about being fast alone. It's about being predictable.
A consistent 90-second tube journey is usually better than journeys that vary between 2 and 12 minutes.
Large swings in transport time make staffing, batching, and prioritization much harder for lab teams.
Automation (like pneumatic tube systems) and well-designed courier routes can significantly reduce variability.
Laboratory Transport and Pre-Analytical Quality
Transport doesn't only affect speed. It also influences pre-analytical quality, which is known to be a major source of lab errors.
Temperature, Agitation, and Time
Depending on test type, specimens can be sensitive to excessive vibration or shock, temperature deviations, and extended time before processing or centrifugation.
What works:
Use validated packaging and carriers (whether manual or pneumatic)
Define time limits and handling rules for specific specimen types
Apply clear policies for what can and cannot be transported via pneumatic tube
For example, many hospitals validate tube systems for blood and a wide range of routine labs, but may restrict certain tests or blood products to manual transport unless specifically validated.
Chain-of-Custody and Traceability
Good laboratory transport design makes it easy to answer:
When was this sample collected?
When did it leave the unit?
When did the lab receive it?
Barcode scanning at send/receive points, coupled with laboratory connection to the LIS, allows:
Faster root-cause analysis when delays or errors occur
Better compliance with regulations and policies
More precise continuous improvement initiatives
Common Transport Models (and Their Tradeoffs)
Different hospitals rely on different mixes of transport options.
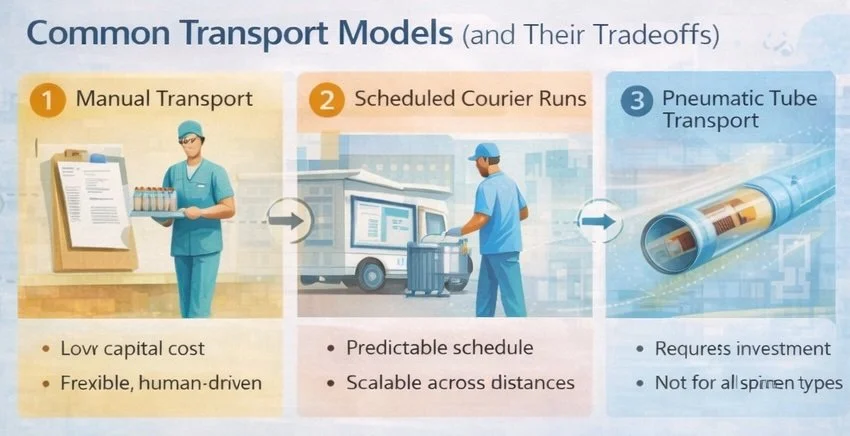
1. Manual Transport (Nurses and Porters)
Strengths:
Low capital cost
Flexible and human-judgment-driven
Limitations:
Highly variable timing (busy staff, shift changes, missing porters)
Hidden labor costs and opportunity cost for clinical staff
Limited traceability
2. Scheduled Courier Runs
Often used for outpatient clinics, satellite facilities, and night shifts.
Strengths:
Predictable schedule
Scalable across distances
Limitations:
Not responsive to real-time clinical needs between runs
Can create batching effects and long waits if timing misaligns with collection patterns
3. Pneumatic Tube Transport
Used for rapid internal transport between wards, ED, OR, and lab, STAT and urgent specimens, and routine inpatient samples once validated.
Strengths:
Fast and consistent transport times
Reduced demand on nursing and porter time
High availability for 24/7 operations
Limitations:
Requires capital investment and thoughtful design
Must be validated for specific tests/specimen types
Needs clear policies and training to be used appropriately
Most hospitals use a hybrid approach. The key is to intentionally design which samples go via which route, rather than leaving it to ad-hoc, unit-by-unit habits.
Building a Better Laboratory Transport Workflow
Improving laboratory transport doesn't have to start with a full redesign. Often, the biggest gains come from making the current system more deliberate and visible.
1. Map Current Flows and Time Buckets
Start by mapping where most specimens are collected (by unit and time of day), how they currently reach the lab (who carries them, how often, via what route), and typical and worst-case times from collection to lab receipt on key routes.
Even a simple spreadsheet or whiteboard map can reveal:
Bottlenecks (everything from ICU and step-down waits for one porter loop)
Inconsistent practices between units
"Black holes" where samples sit unnoticed
2. Standardize When to Use Each Transport Method
Work with lab, nursing, and operations to define:
Which specimens/items must always be hand-carried
Which should always go via pneumatic tube where available
When batching is acceptable and when immediate dispatch is required
Putting this into clear, unit-level SOPs reduces guesswork and variation.
3. Align Transport with Lab Capacity
Transport design and lab operations should be coordinated. If morning draws arrive in one massive batch at 8:30 a.m., consider staggering transport or using the tube system to smooth the flow. If the lab has limited staffing at night, plan courier or tube workflows that prevent big midnight spikes.
A small change in turn time transport (smoothing arrivals by 10–15 minutes) can be enough to keep TAT inside targets without adding staff.
Atreo's Perspective on Laboratory Transport and TAT
Atreo approaches laboratory transport as part of a broader laboratory connection strategy: connecting where samples are taken to where they are processed in a way that is fast, safe, and predictable.
What that means:
Designing pneumatic tube networks around real specimen flows, not building lines on paper alone
Validating tube use for relevant specimen types, in collaboration with lab and blood bank teams
Integrating transport events with LIS/HIS where possible, so labs and operations teams can see not only "how fast the lab is," but how long samples spend in transit
When hospitals make laboratory transport visible and measurable, they're often surprised by how much improvement is possible without touching a single analyzer.
Key Takeaways for Leaders Focused on TAT and Quality
Laboratory transport is a major (and often overlooked) component of total lab turnaround time.
Variability and delays in sample transportation can erode TAT, regardless of how advanced your analyzers are.
Pre-analytical quality (temperature, vibration, time to processing) is tightly linked to how specimens are transported and handled.
Hybrid transport models (manual + courier + pneumatic tube) work best when they're intentional: clear policies define what goes where, when, and how.
Mapping current flows and time buckets is the fastest way to identify where transport changes will have the biggest impact.
Next Step: Schedule a Support Consultation
If you're under pressure to improve lab TAT or reduce pre-analytical errors, looking at analyzers alone won't tell the full story. A focused look at your transport flows can.
Schedule a Support Consultation
We'll:
Review your current specimen routes and handoffs for key units and tests
Discuss transport times, variability, and where "hidden minutes" are accumulating
Highlight practical changes (from policy to automation) that can shorten TAT and protect sample quality
Frequently Asked Questions About Laboratory Transport
How much of lab turnaround time is due to transport?
It varies by hospital, but for many inpatient workflows, 30–50% of total TAT can be tied to time between collection and lab receipt, especially when transport is manual or batched.
Is a pneumatic tube system always the best option?
Not always. Pneumatic tube systems are excellent for many routine and STAT specimens, but each hospital should validate which tests and specimen types are appropriate. Some items (certain blood products, fragile samples) may require manual or specially controlled transport unless specifically validated.
What's the first step to improving laboratory transport?
Start by measuring and mapping. Identify where specimens are collected, how they move today, and how long that movement takes. Once you can see your current state, it becomes much easier to choose whether process changes, staffing, or automation (like pneumatic tubes) will have the biggest impact.