Tat Time vs. Turnaround Time: What Hospital Leaders Actually Need to Measure
If you search "tat time" online, you'll find everything from tattoos to lab metrics. Inside the hospital, it can be just as confusing.
Clinicians say, "The lab's TAT is too slow." Operations leaders ask for "tat time" reports. Different departments use the tat acronym medical in slightly different ways.
Meanwhile, patients and ED leaders care about one thing: "How long does it take from decision to order a test until the result is in front of the clinician?"
This article untangles tat time vs. turnaround time, explains what TAT really means in the tat time laboratory context, and shows hospital leaders what they actually need to measure if they want faster, more reliable care.
What Does "TAT" Actually Mean in the Lab?
Let's start with the basics.
In the tat acronym medical sense, TAT usually stands for Turnaround Time—the elapsed time between two defined points in a process.
In the tat time laboratory world, the most common definition is:
Lab TAT = Time from specimen receipt in the lab to result verification/release.
That is:
Specimen arrives in the lab (arrival time stamped in LIS)
Pre‑analytical work is done (centrifugation, aliquoting)
Analysis is performed
Result is verified and released
This definition is useful for lab performance tracking. But it tells only part of the story hospital leaders actually care about.
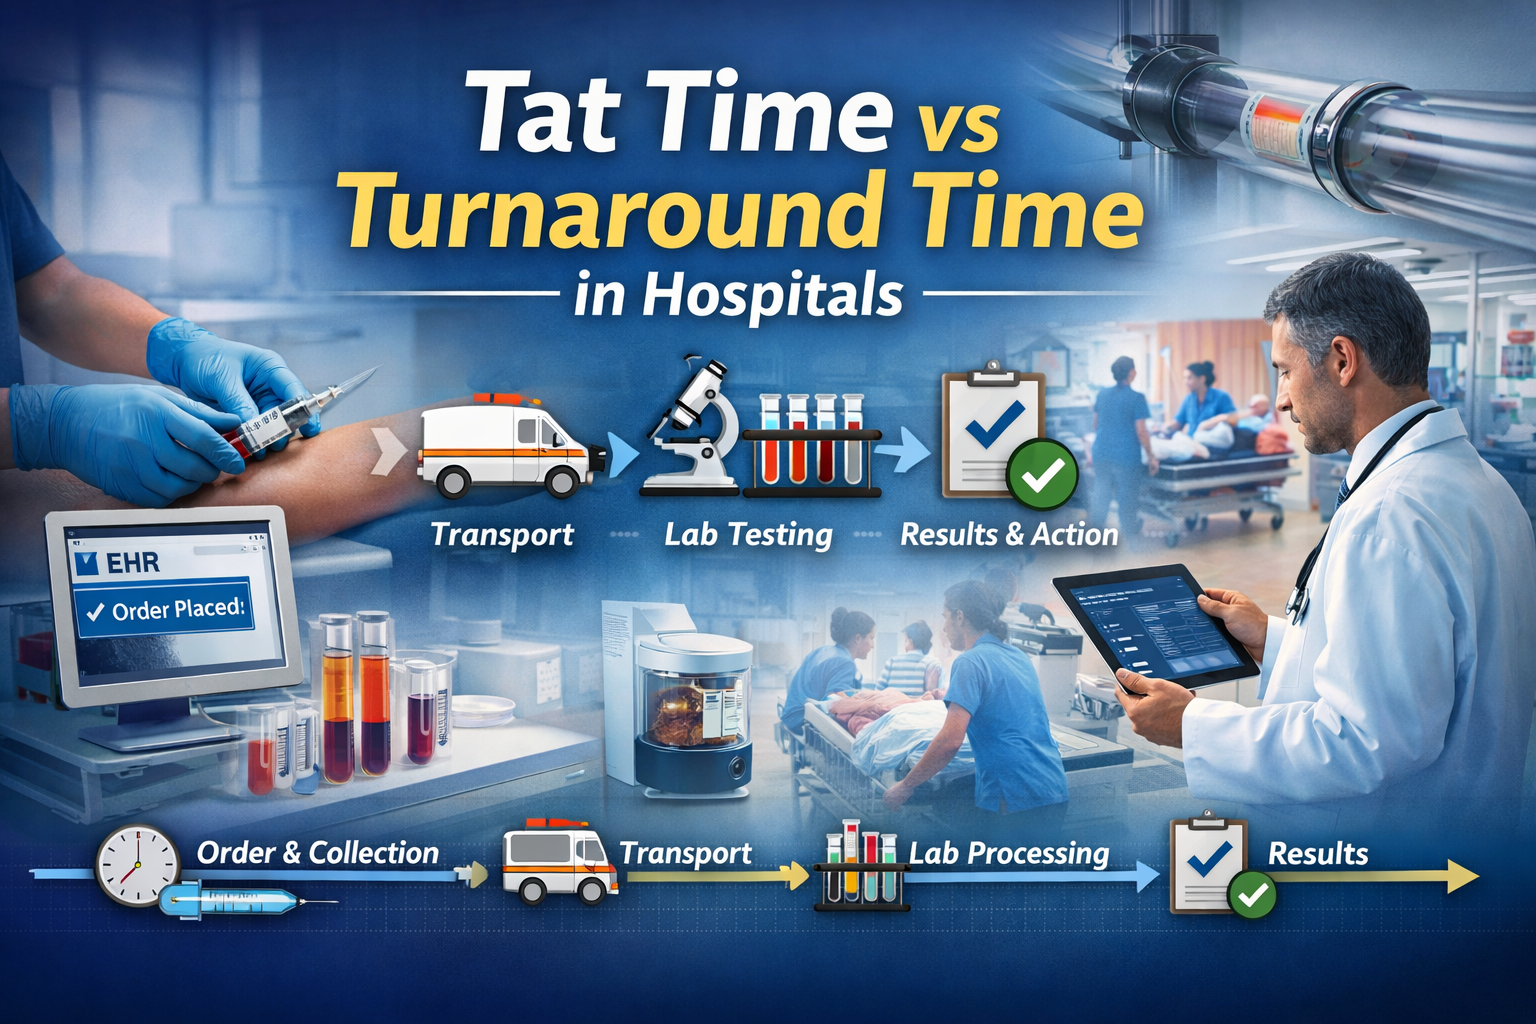
From a clinical or operations perspective, a more complete view is:
Total TAT = Order Time → Specimen Collection → Transport → Lab Receipt → Result Release → Result Seen and Acted On
When someone says "tat time is too long," they're often lumping all of this together—even if only part of it is under the lab's direct control.
Read more here: "From Vein to Result: The End‑to‑End Journey of a Blood Sample in the Hospital."
Why "Tat Time" Becomes a Problematic Shortcut
So where does "tat time" go wrong?
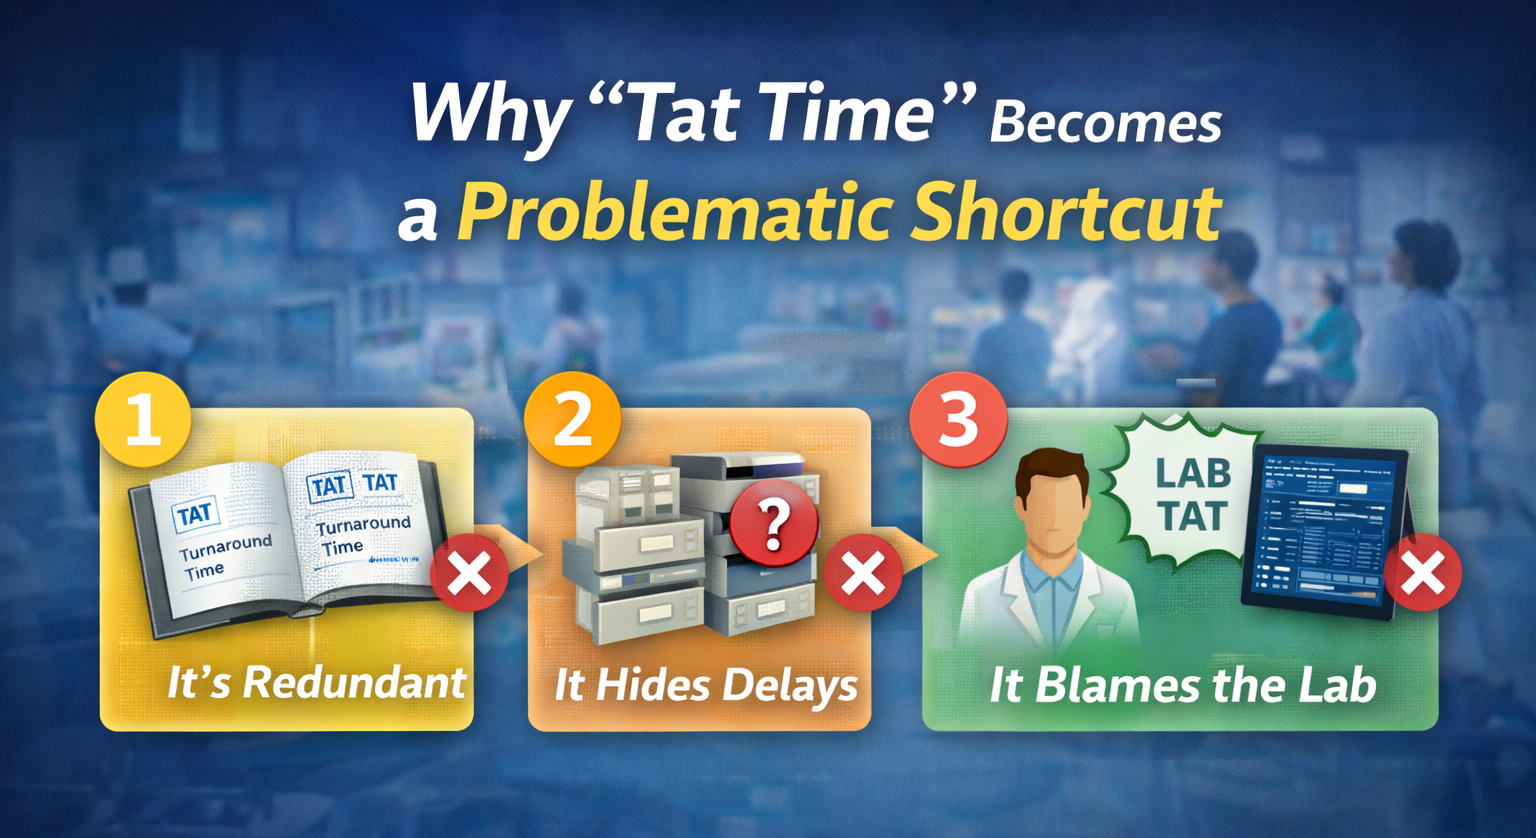
1. It's redundant
"Tat time" literally says "turnaround time time." It signals that different people may be using tat loosely, not as a well‑defined metric.
2. It hides where delays really occur
A single "TAT time" number doesn't tell you:
How long orders sit before collection
How long samples sit on the unit before dispatch
How long transport takes
How long the lab actually needs to process and verify
3. It often blames the lab for non‑lab problems
If clinicians only see "LAB_TAT," they may assume the lab is slow even when:
Most delay is between collection and lab receipt
Specimens arrive in big, irregular batches
Transport is manual and inconsistent
To fix tat time issues, leaders need to stop asking only "What's the lab's TAT?" and start asking, "Where, exactly, is time being spent from order to result?"
Breaking TAT into Components Hospital Leaders Can Act On
A more useful approach is to break tat time into its major components and measure each one.
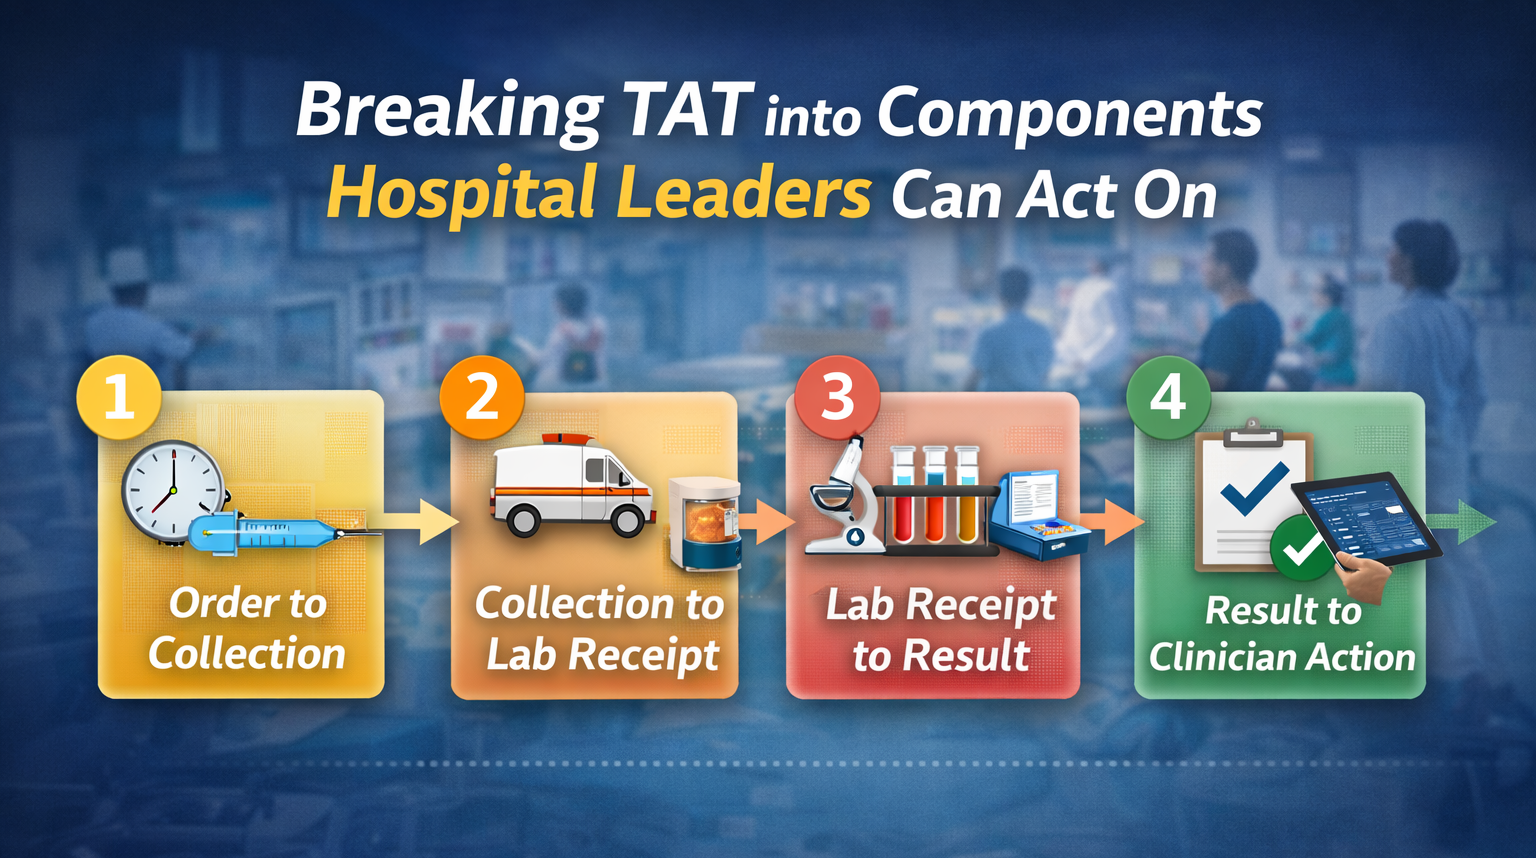
1. Order to Collection
Time from order entry in the EHR to successful blood sample collection.
Driven by:
Phlebotomy and nursing workflows
Rounding patterns and staffing
Patient availability (in ED, OR, wards)
Why it matters:
Long order‑to‑collection intervals make every downstream improvement less visible. This piece is often invisible in traditional tat time laboratory reports.
2. Collection to Lab Receipt (Transport Time)
Time from successful collection to the moment the specimen is logged in at the lab.
Driven by:
Local holding and batching behavior on units
Use (or avoidance) of pneumatic tube system hospital routes
Porter schedules and manual walks
This is where Laboratory Transport 101 comes in: transport can easily account for 30–50% of total TAT for routine inpatient testing.
Read more here: "Laboratory Transport 101: How Sample Movement Shapes Turnaround Time and Quality."
3. Lab Receipt to Result (Core Lab TAT)
The traditional tat time laboratory metric.
Driven by:
Pre‑analytical processing
Analyzer capacity and uptime
Staffing and prioritization rules
This is the part labs usually monitor well. It's important—but it's not the whole story.
4. Result to Clinician Action
Time from result release to when it is actually seen and acted on.
Driven by:
Alerting mechanisms (critical value calls, EHR alerts)
Clinician workflows and coverage
You don't need to measure this in detail for every test, but for critical pathways (e.g., ED chest pain), this interval can be as important as the tat time itself.
What Hospital Leaders Should Actually Measure
Rather than one undifferentiated "tat time," leaders should focus on a small set of named, standardized intervals for key test groups (e.g., ED chemistry, CBC, troponins, blood gas).
For each, define and track:
Order‑to‑Collection Time
Collection‑to‑Lab‑Receipt Time (transport)
Lab‑Receipt‑to‑Result‑Release Time
Optionally: Result‑Release‑to‑Clinician‑Viewed/Acted
Why this works better:
You can see where the bottleneck truly is. Lab and operations can share responsibility rather than argue over a single number. Changes to phlebotomy, transport, or lab processes have visible, component‑level effects.
Read more here: "Why TAT for Blood Samples Is Important in Hospital Operations" when discussing which tests and intervals to prioritize.
The Role of Internal Logistics in TAT: More Than Analyzers
A common pattern in tat time discussions is focusing heavily on analyzers and automation while ignoring internal logistics.
But for many hospitals:
Analyzers are already fast and reliable.
The bigger variation lives before the sample reaches the lab.
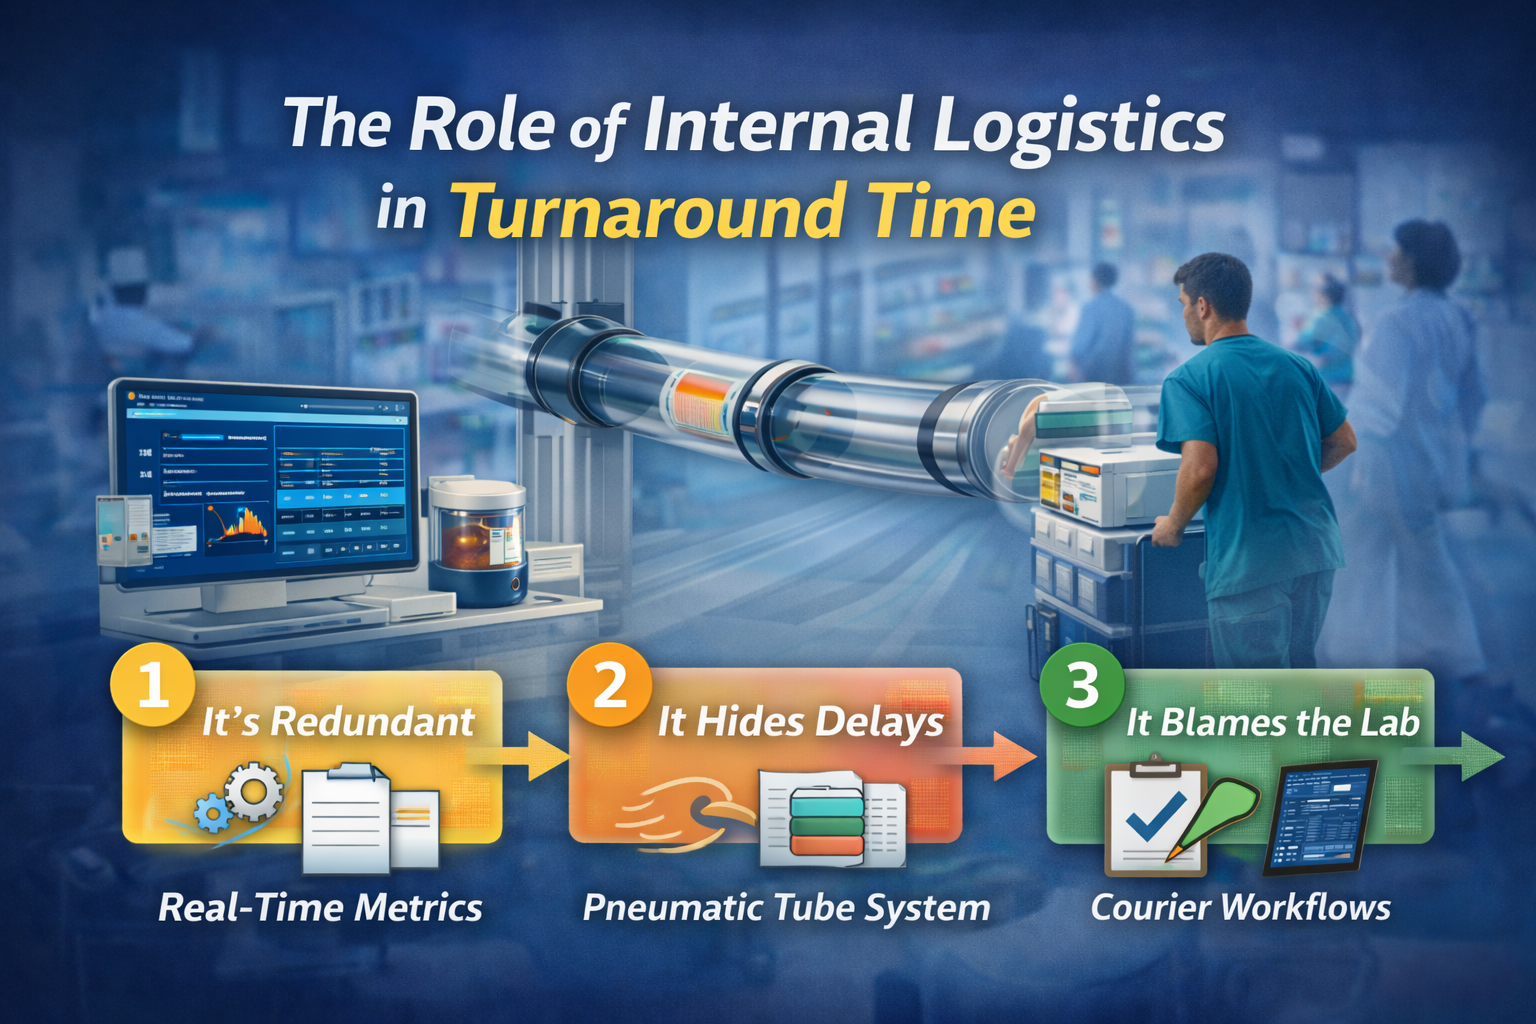
Key internal‑logistics levers:
Pneumatic tube system hospital design and validation
Direct routes between ED/OR/ICU and lab
Priorities for STAT vs routine traffic
Safe specimen lists to build trust and usage
Porter and courier workflows
Scheduled vs ad‑hoc runs
Coverage patterns by time of day
Unit‑level dispatch behavior
Batching vs immediate send
Clarity on when to tube vs walk
Read more here: "Pneumatic Tube Systems in Hospitals: Design Best Practices for 24/7 Reliability"
Improving these pieces often yields more TAT improvement than another analyzer upgrade.
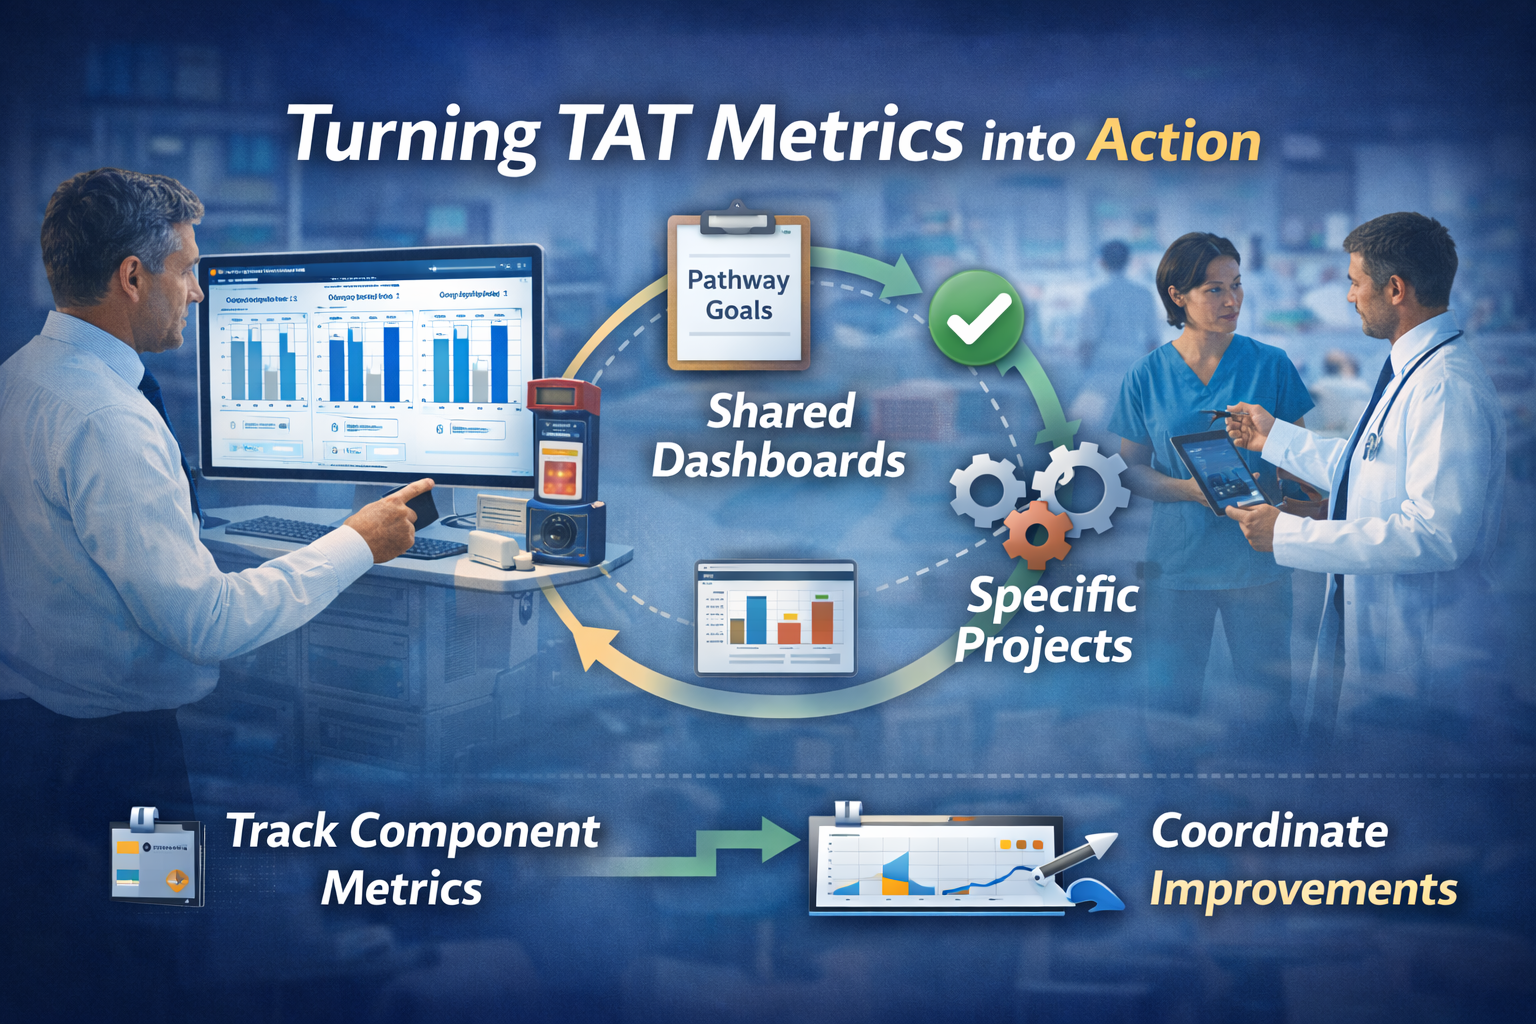
Turning TAT Metrics into Action
Once you've defined and started measuring the right pieces of tat time, the next step is to use them.
Step 1 – Pick a Few Critical Pathways
Start with 3–5 high‑impact test groups:
ED chemistry / CBC / troponin panels
OR and ICU STAT labs
Time‑sensitive tests tied to protocols (e.g., sepsis, stroke)
Measure defined TAT components for these first rather than trying to boil the ocean.
Step 2 – Create Simple, Shared Dashboards
For each pathway, show:
Median and 90th/95th percentile times for each component
Trend lines over time
Simple comparisons by unit (e.g., ED vs two high‑volume wards)
The goal is not perfection—it's visibility.
Step 3 – Link Projects to Specific Components
Instead of "improve tat time," frame improvement efforts as:
"Reduce collection‑to‑lab‑receipt time from Ward X by 5 minutes."
"Smooth morning draw arrivals so lab‑receipt‑to‑result‑release stays under Y minutes at peak."
That makes it easier to choose the right interventions and to see if they're working.
Atreo's Perspective on TAT and "Tat Time"
Atreo views tat time as a system property, not just a lab metric.
In practice, that means:
Mapping the blood sample journey from order through collection, transport, and lab processing
Designing internal logistics—especially pneumatic tube networks—to support consistent, fast Collection‑to‑Lab‑Receipt times
Helping hospitals interpret TAT data so they can distinguish analyzer issues from transport and dispatch issues
When the right pieces are measured and the internal logistics are designed around real flows, "tat time" conversations become more productive:
Less "the lab is too slow."
More "here's where we're losing 10 minutes on this route, and here's how to fix it."
Key Takeaways on Tat Time vs. Turnaround Time
In the tat acronym medical context, TAT is a specific, definable interval—not just a vague sense that "things are slow."
Traditional tat time laboratory metrics capture only part of the journey that matters to patients and operations.
Breaking TAT into Order‑to‑Collection, Collection‑to‑Lab‑Receipt, and Lab‑Receipt‑to‑Result makes it clear where delays really live.
Internal logistics—tube systems, porters, dispatch habits—often drive as much variation in tat time as analyzers do.
When leaders measure the right components and design transport accordingly, improving TAT becomes a shared, solvable problem.
Next Step: Talk with Atreo About Your TAT Data
If your hospital sees "tat time" complaints but isn't sure where the delays actually are, or if lab TAT looks acceptable while clinicians still feel results take too long, it may be time to look at the full journey.
Contact us to:
Review how you're currently defining and measuring TAT
Identify where order, collection, transport, and lab processes are adding hidden minutes
Discuss practical options—especially around internal logistics and tube design—to make turnaround times faster and more predictable
Frequently Asked Questions About Tat Time and Turnaround Time
What does “tat time” mean in a lab?
In the lab context, tat time usually refers to turnaround time (TAT)—the time between two defined points in the testing process. Traditionally, tat time laboratory metrics mean “from specimen receipt in the lab to result release,” but for hospital leaders it’s more useful to look from order to result, not just the lab slice.
What is a good TAT for ED labs?
There’s no single standard, but many hospitals aim for core ED panels (basic chemistry, CBC, troponin) to have a Total TAT of about 45–60 minutes from order to result, with shorter goals for critical tests. The key is to define and measure the components—order to collection, collection to lab receipt, and lab receipt to result—so you can see where delays actually live.
Why is our lab TAT data different from what clinicians feel?
Most tat time laboratory reports only measure from lab receipt to result. Clinicians, however, experience TAT from order to result. If there are delays in collection or transport, they will feel “slow TAT” even when lab‑only TAT looks acceptable. Splitting TAT into clear intervals helps align perception with data.
How can we improve TAT time without buying new analyzers?
Often, the fastest gains come from upstream changes: speeding up collection for key tests, improving use of your pneumatic tube system hospital routes, reducing batching on units, and smoothing specimen arrivals to the lab. Many hospitals see TAT improvements by redesigning transport and dispatch habits before investing in new instruments.